Chair’s Column March 2022 - Inclusive Excellence Starts with Knowing Who We Are

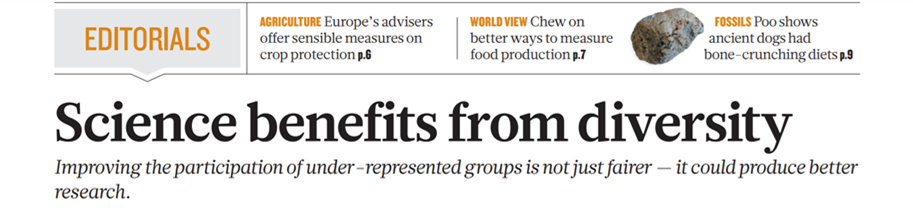
There is an abundance of evidence that diversity (ethnic, gender, disciplinary and academic background) makes us better. A series of articles in the journal Nature in 2018* provided evidence for the value of diversity in scientific endeavours. US Astrophysicist Keivan Stassun comments that he has found that diverse perspectives increase the frequency of ‘aha’ moments. He states that he is “…intentionally bringing in people from diverse backgrounds and with diverse ways of thinking because it forces us all out of easy assumptions”.
 Thus, taking action to ensure that our Department of Medicine (DoM) is representative of the learners we educate and the communities we serve is a top priority – inclusive excellence will help us to be even better educators, scientists and clinicians.
We want to believe that meritocracy is the way the system should & does work – that those who work hard and excel at their academic activities will be promoted based on their achievements – their ‘merit’. But there is copious evidence, including here at the University of Toronto, that this is not the case – that biases, both conscious and unconscious, embedded in the structures of our academic system mean that the likelihood of success for two equally skilled individuals is not solely determined by their ‘excellence’ or ‘hard work’. Success in academic medicine is very much influenced by the quality and quantity of early career support, including mentorship, sponsorship, role models and social networks, as well as by one’s personal circumstances and access to essential resources, e.g., through funding, support for clinical practice, and philanthropy. As Reena Pattani recently published in Medical Teacher, these essential ingredients of success are not shared equally among department members. Thus, achieving our goal of inclusive excellence is unlikely to happen without intentional changes in how we work support one another.
Importantly, we cannot measure progress towards our goal of diversity and inclusive excellence without knowing what we look like now. The DoM has been collecting and analyzing our own demographics information over time and has developed strategies to move towards improved gender equity. Gender is, of course, only one element of diversity, and there are many other aspects of people’s identities that may result in inequities and/or discrimination, including (but not limited to) age, race, ethnicity, religion, Indigeneity, self-identification as LGBTQ2S+, disability, childhood socioeconomic status, and immigration status.
For this reason, we launched the first ever DoM Self-identification Survey last fall (Oct-Nov 2021), under the leadership of Faculty Lead, Equity, Dr. Umberin Najeeb. To encourage participation, the survey was conducted fully anonymously – responses were provided unlinked to specialty/division or hospital affiliation. Of over 1500 faculty members we heard back from 562 giving a response rate of 36%.
Here are the highlights of what we learned:
- Of the faculty respondents, less than half (48.1%) self-identified as White. One in five identified as Jewish (19.3%), as East Asian 14.9% and 14.2% as South Asian. Smaller proportions self-identified as other groups, and very few identified as Black (2.3%) or Indigenous (0.9%).
- Compared with Toronto residents in 2016 : women, Blacks, Filipinos, and Indigenous peoples are under-represented in our department.
- One-quarter of participants (24.9%) indicated that they were ‘definitely’ or ‘probably’ identifiable as a member of a specific religion based on their appearance/something they wear. Greater accommodation for religion (dietary needs, celebrations, place of worship) would enhance our diversity efforts.
- One-third of our respondents were born outside Canada, 28% completed their medical training outside North America, and our faculty speak more than 31 languages!
- 17.8% identified as having grown up in a low income or lower middle-income family compared with 41.8% who grew up in an upper-middle or upper income environment. Almost one in five identified as having a physician parent.
- Compared with Toronto residents in 2016, people from lower income families are under-represented in our department.
- 43.9% self-identified as women, 52.8% as men, and 1.4% as transgender or non-binary.
- One in five respondents were ≤ 40 years of age, most were living with others (87.6%) and most were parents (61.6%). Of the 318 with children, 29.2% had toddlers, 44.3% pre-teens, 31.8% teenagers, and 28.3% adult children.
- A significant proportion (22.8%) had caregiver roles for their elderly parents and/or family members. 10% identified as having a disability, the most common being a chronic medical illness. Greater accommodation for caregiver responsibilities would enhance our diversity efforts.
- Participants supported ongoing efforts to increase the representation of diverse perspectives among DoM leadership and in recruitment/selection processes, opportunities for mentorship, sponsorship, and empowerment, and education on implicit and explicit bias. We agree and the DoM continues to support a number of initiatives in these areas. If you would like to get involved, please reach out to dom.cultureandinclusion@utoronto.ca.
Summary:
We are delighted to have achieved this first snapshot of the diversity of our DoM community by a self-identification survey. Thank you to those who participated. The information gained tells us who is here and, importantly, who is not. Your help in addressing the identified gaps through the many strategies the department has already, and will in future, adopt to achieve our goal of inclusive excellence is critical.
Additional data from the survey can be reviewed here.
* Nature 558, 19-22 (2018) doi: https://doi.org/10.1038/d41586-018-05316-5; and Nature 558, 5 (2018) doi: https://doi.org/10.1038/d41586-018-05326-3